Servant, not Master
(some pitfalls of looking at win rates in limited, but why you should still do it)
Posted by Sierkovitz, 2021-04-27
17Lands has become a household name—at least in households with a hardcore Arena limited grinder. This sudden popularity is definitely well deserved and very welcome, but it comes with one slight drawback. Data is not easy to interpret, and wide availability of this data leads to many misinterpretations and oversimplifications. There is plenty of content written by people who are highly skilled in data interpretation, and I would very strongly recommend consuming as much of it as you physically can. Sam Black and Ryan Saxe spring instantly to mind when I think of people who approach the data cautiously and understand the caveats linked to data interpretation.
But oftentimes, data is used in a less spectacular manner. This leads to frustrations, misinformation, and quarreling, all of which we love to avoid. 17Lands is all about data sharing, and this won’t change in the future. If anything, data will become more available over time. We don’t want to stop people from having their go at the data, in fact, we encourage it. But we also want to make sure that superficial arguments don’t dominate discussion about card win rates. And statements like “X has a higher win rate than Y on 17Lands, so it is better” have become more and more frequent to the point they became annoying, which is definitely something we don’t want to happen. And, in my opinion, rightfully so for many reasons.
Data, as I see it, should be an aid, a starting point on a quest to answer some questions. Using it to end a discussion is a dangerous precedent, especially since the interpretation of even a simple win rate is not at all straightforward. To, hopefully, give you a better idea on how big of a minefield data interpretation can be, I wanted to dig a bit into some properties you might want to consider while looking at win rate data. If you are looking for analyses of particular cards, turn back - you won’t find much here. This article is strictly about giving away fishing rods; no fish will be distributed to readers.
To start, there are different win rates (from now on - WR) you can get from 17Lands. The basic one is the WR when a card is in a deck (GP WR). This counts both the games where you drew that card and those where you didn’t. If you see approximately half of your deck every game, then half of the data over which the metric is computed comes from the games where you don't draw the card in question. In other words, half of the data the metric is computed over is actually complete noise - in half the games, the card could have been any other card, and the game outcome would have been the same. Additionally, the strength of the decks a card goes into will impact the card’s winrate. A strong card that can be played in weaker archetypes, and a mediocre card that is only playable in a single strong archetype may have GP WRs that are closer than you would expect.
Another WR is the WR when a card is drawn. This comes in three varieties on 17Lands: WR when a card was in the
opening hand (OH WR), WR when it was drawn later (GD WR), and a mix of those two: WR when a card was drawn at all
(GIH WR). These metrics give much more of a card’s signal, as they only take into account games where a card was
drawn. This means that in most of those games a card had some impact on the outcome - for good or for bad. Still,
some of those games even do not give us much information, as the card was drawn in last turn and had no realistic
impact on the result, but those will be only a small fraction of the games. This effect may be small but can be
important, as not all cards are equally impacted by it. For example, drawing a random 2-drop when you needed to
deal with a threat will often result in a loss, but drawing a
All those three WR types give you more information on the card strength, but they come with the same caveat: cards are not equally good in each archetype/subarchetype they are played in. This is why often you will see multicolour cards as having top win rates according to this metric - they will be more frequently fine tuned to fit a particular archetype where they are at its best. Mono colour cards will be more frequently played in a deck they don’t fit well. To remove this bias it is a good idea to look at the win rates of a card in different colour combinations and this way see where are they at their best. Maybe a red card that has 57% WR is actually worse than a 55% WR card, if you're in Prismari, where the former card has a 54% win rate and the latter card has a 58% win rate.
There are more limitations of these metrics. WR in opening hand, for example, will give you a guideline of which card is amazing when drawn early. But you draw it early only in a few games in a draft. In some games you draw it late. If a card has a very high opening hand WR but average win rate when it was drawn at all, you should conclude that even if the card is powerful early, it becomes a hindrance late in the game. Looking only at opening hand data can give you a very wrong impression. On the other hand, some cards are way better in long games, so they are put into decks which aim to play longer games. In longer games, you see more of your deck. Historically, these decks also sometimes lose rapidly - think of a multicolor deck splashing bombs that gets run over by a fast aggro deck before it can establish its mana base. Rapid losses and long wins means that in games lost, those cards are much less likely to have been drawn because they were way shorter, while in games won they are more likely to be drawn. This disparity inflates these cards’ GIH WR.
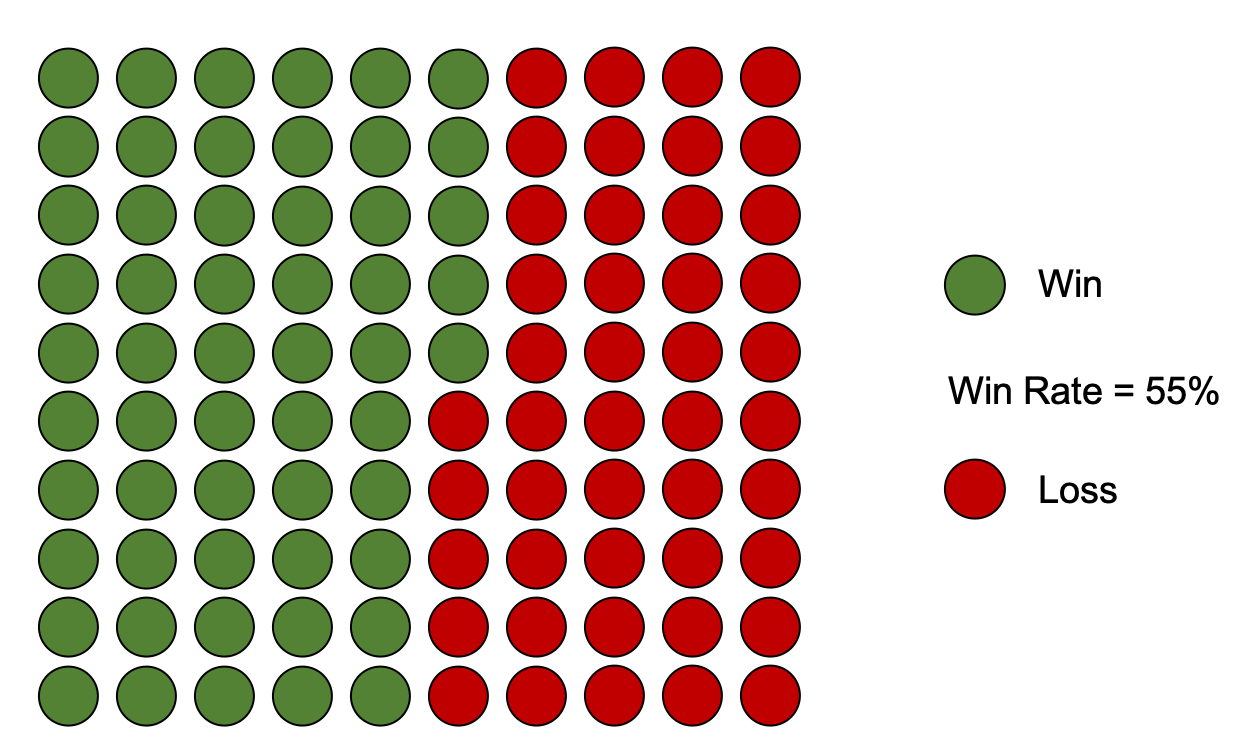
Now you should have a good idea of general metrics. But even that is far from enough. To get a full grasp of the complexity of this simple WR number, let's look at what constitutes the number. I will give you the glimpse of how I see them. Win rate is a proportion of games won by a card. Imagine 100 points. 55 of them green (wins) 45 red (losses).
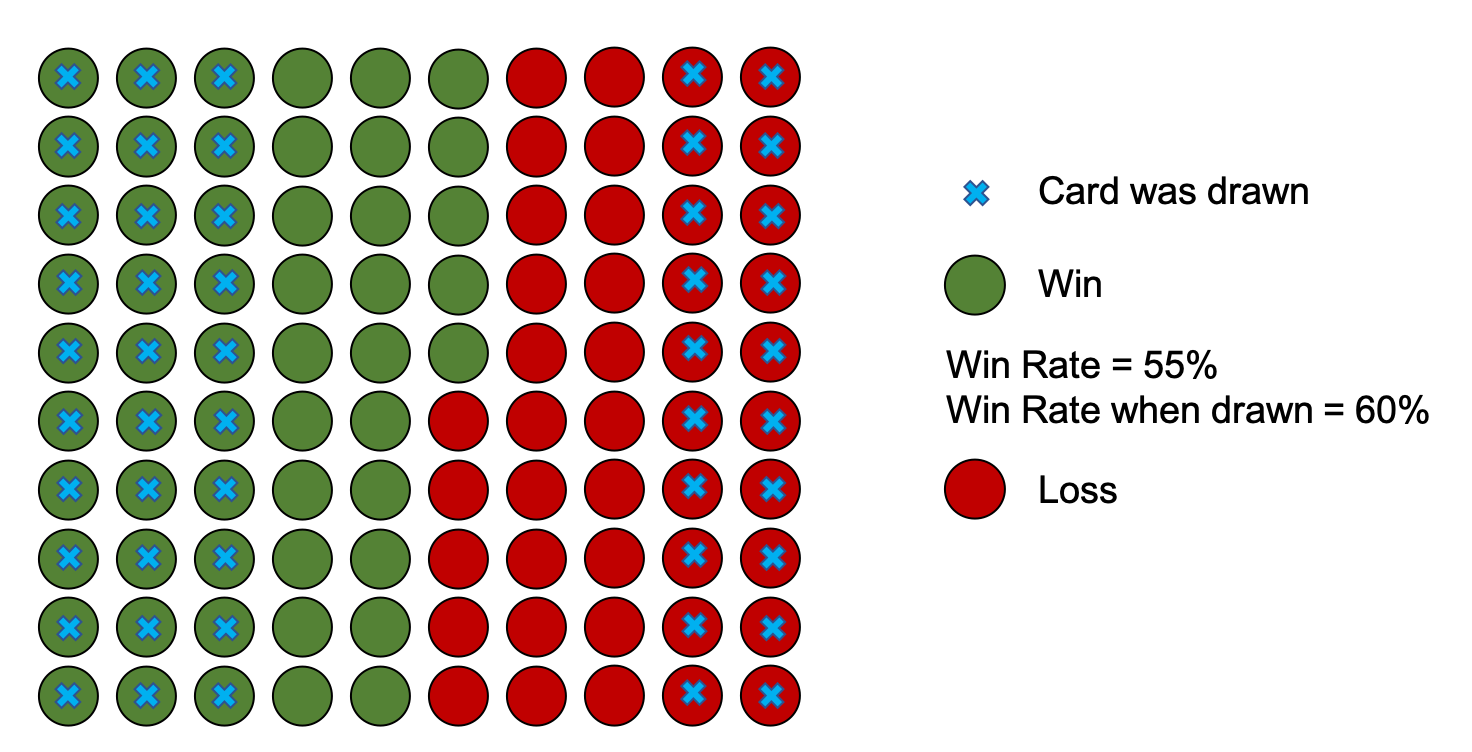
But hey, only in 50 of those games the card was drawn. Let’s add that piece of information. Now we know our card
had the win rate when drawn of 60%. That is a good signal that it actually is good, but it is only a hint. We know
nothing of those 50 games when it was drawn. The thing with drawing the cards is, the longer the game lasts, the
bigger the chance of drawing things. We can’t say from these raw WR numbers whether it is the card in question
that may help you win or if it was the rest of the deck doing well that allowed you to draw into it and make the
game last long enough to draw it. In case of some late game bombs,
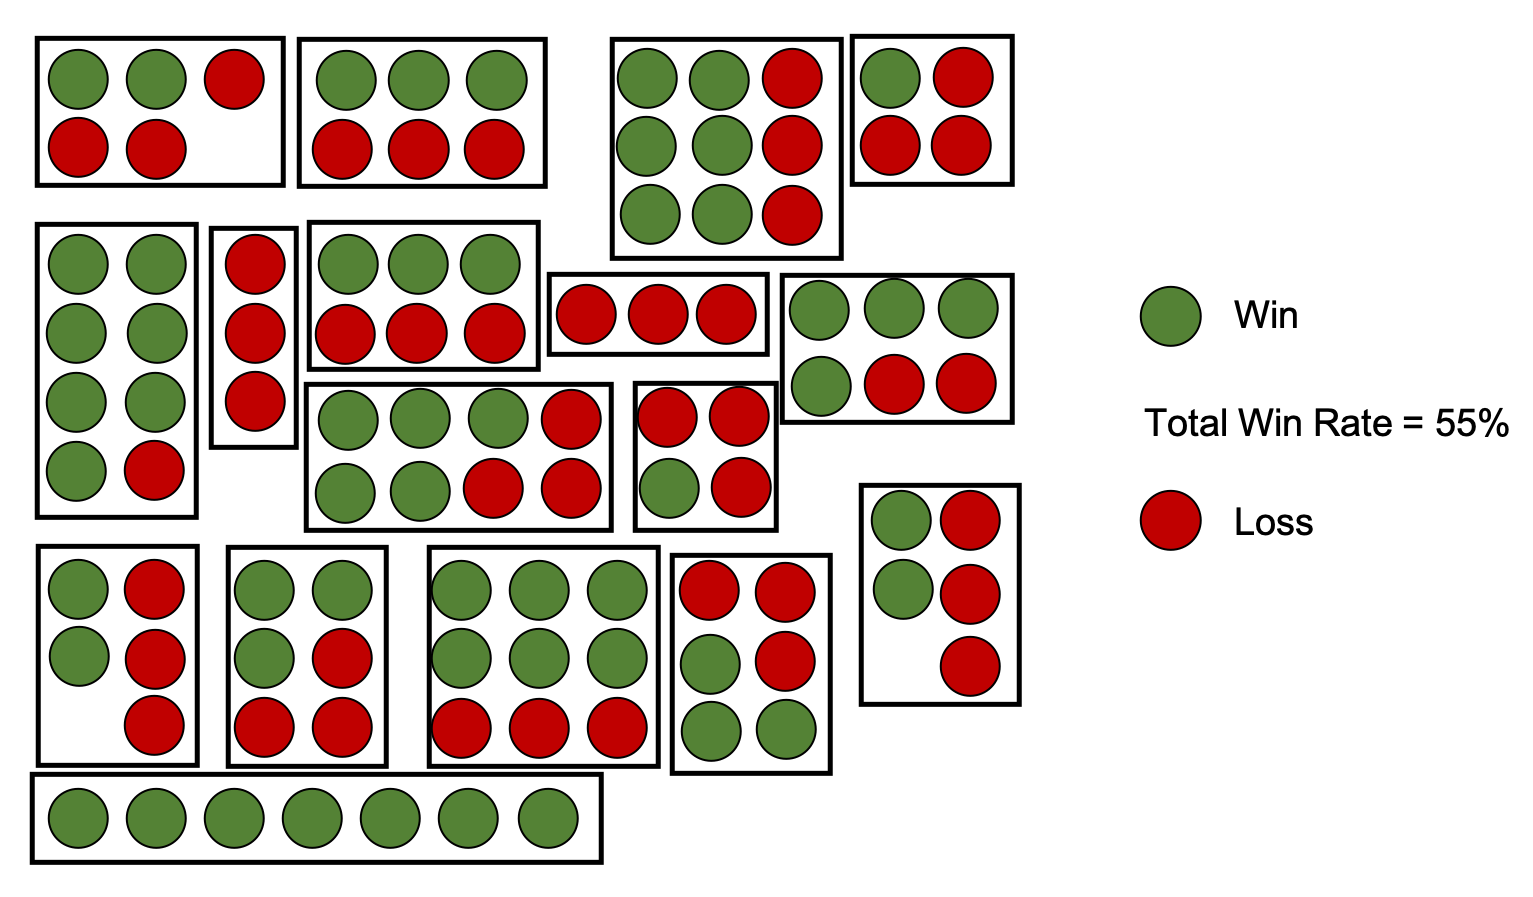
Even this picture is way oversimplified, because as I mentioned before, cards are in decks. So some of those points I neatly arranged are linked. Let’s rearrange our dots by decks they were in. Now we end up with 17 decks that in total had 100 games with the same 55% win rate on average. But as you can see, even though there were 2 trophy decks and a fair amount of 6-3, there was also a fair share of 1-3 and 0-3s. You can’t know this from the raw WR number. It could have easily been a bunch of 4-3s, and the result would be the same. The distribution of deck win rates can mean something. For example, it can mean that the card we are looking at has a home where it is very good, but in some other decks, it is actually pretty bad. This will be particularly apparent in case of build-around cards. If 17Lands users know how to build a deck around a particular card, it may have a very high win rate—but that doesn’t mean you should jam it just anywhere.
Build-arounds are a particular case but this applies to any card really. One big discussion during Kaldheim was on
And here comes one of the most important takeaways: WR is a way better indicator early in a draft. That is when you should consider the raw power of each card the most. The later in a draft, the more you should focus on your game plan. And this means pure WR is not always the best indicator. If you are short on 2-drops, you should prioritise a solid 2-drop over a 4-drop that is better on paper. When you play a control Lorehold deck, aggro cards with higher WRs are not necessarily better than lower WR cheap removal. I am sure you can think of many more excellent examples.
There is another aspect of WR. WR are averages of performances of average-to-good players. I am an average player. I know I do many things wrong. I make bad play decisions, I build my mana base badly at times, I play overly optimistically with subpar cards in hopes of meme wins, I struggle in the beginning of a set, I sometimes draft on autopilot because I am hasty or tired. The data you are using is also based, in small part, on my drafts. I am not the only person like that who contributes to the data. Actually, the majority of the data is based on players at my level. This means that the WR data is in a way more useful to players at lower or average level and that following the data blindly might just make you a very average player. Think of the data as a humble servant that lets you improve your draft and gameplay. Not as a master that dictates your picks. With a flexible approach, incorporating both data and some degree of artistry, you will get much further in your quest to become a better player.
And this is not all. A lot of how a card performs in your hands depends on your play style. Some cards are easier
to utilise efficiently: it's hard to go wrong with solid unconditional removal. Others are much more nuanced and
will underperform when you play them in the wrong spots, but they can be really strong if you play them at key
points. (For example,
You can imagine that an experienced player with experience in the format will be very good in building around a card, while someone lacking experience and still developing their limited skillset might struggle. Conversely, cards that are simple but efficient might not increase win rates of limited virtuosos, as they can’t squeeze much more than what it says on the tin from those cards. Some cards can vastly improve the performance of newer players through their sheer power level. Disparity in performance based on player skill level is something you should definitely think about when looking at raw win rate stats.
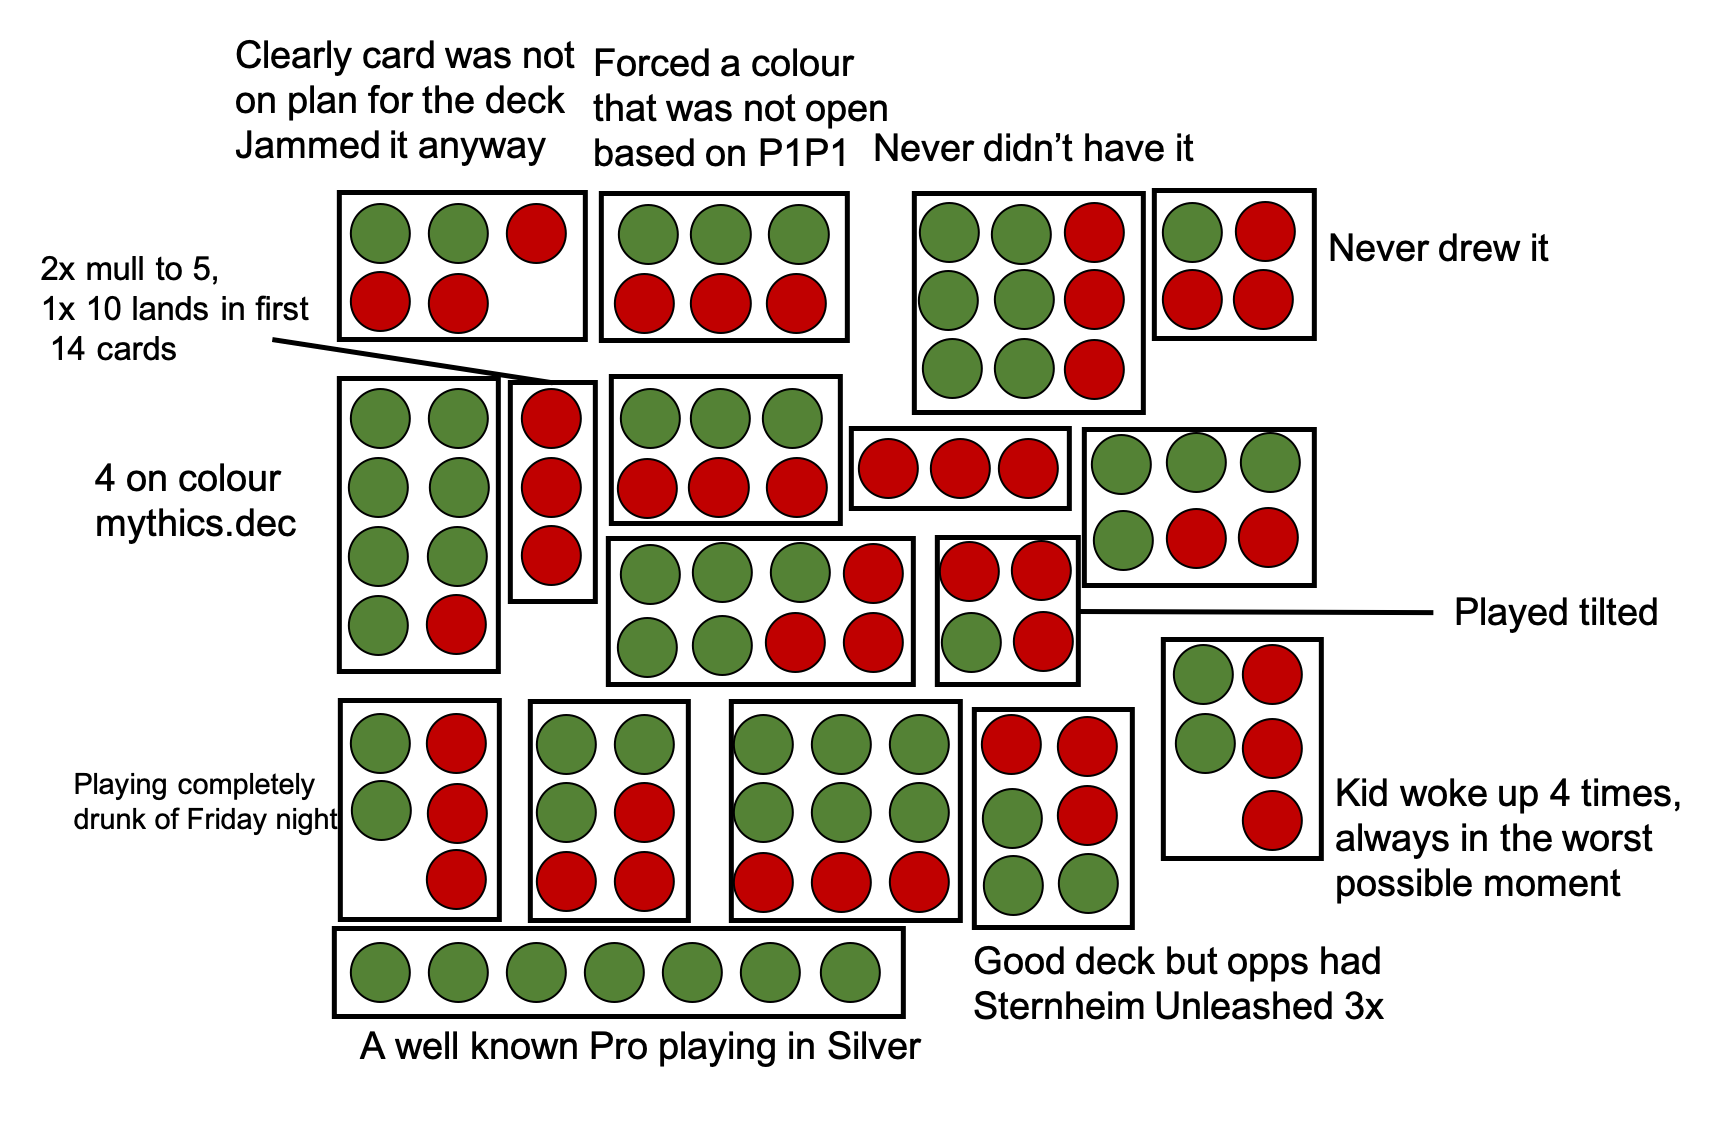
I will leave you with this tongue in the cheek adaptation of my previous scheme to give you some potential examples of what can be wrong with the data. Obviously, these are probably borderline cases, but for the sake of looking at the numbers cautiously, maybe it is worth to at least have the capacity of imagining them?
To close on a positive and cheerful note: 17Lands’ philosophy is to get people into Magic data. We really want you to dip your toes into the datasets we generate and we definitely encourage anyone to try. You can find public datasets available to literally anyone. Many good features we offer started with someone playing with the data we provide. However we do know that data analysis can be tricky. If you would like to play with the data, use it for your own pleasure, or start dabbling in data content creation, we strongly encourage you to join the 17Lands Discord channel, where 24/7 you can find other data lovers and chat, exchange ideas, troubleshoot in a non-judgemental environment. By all means, come and visit!